Blackjack Basic Strategy Chart: Match the Chart to Your Table and Cut the House Edge from 0.53% to 0.14% (Hard 16 & Soft 18 Explained)
Estimated reading time: 6 minutes
Key takeaways
- Use a rules-matched basic strategy chart for the exact table you’re at—decks, S17/H17, payouts and doubling rules matter.
- Small rule differences change the house edge by tenths of a percent; matching a chart can reduce expected loss from ~0.53% to ~0.14% under common Strip rules.
- Generate the exact chart with a strategy tool (for example, the Wizard of Odds generator) and memorize a few high-frequency plays.
Why the exact chart matters: decks, S17, payouts and real percentages
Basic strategy isn’t a single universal map. It’s a family of maps that shift depending on the table rules.
The math isn’t fuzzy—small rule tweaks change the house edge by tenths of a percent. Those fractions matter when you play big or often.
For example, the number of decks can swing the edge a lot.
One analysis shows the same rule set produced a house edge as low as 0.014% with a single deck and as high as 0.577% with eight decks, holding other conditions constant.
That’s not theoretical hair-splitting; that’s why you should care whether you’re at a four-deck shoe or a six-deck tray.
Other rule effects are real and measurable too:
- Late surrender can change the edge by about 0.08%.
- Allowing doubles on any number of cards moves things roughly 0.23%.
- Switching from single to double-deck in one comparison was about 0.19%.
These figures come from the Wizard of Odds’ analyses and their house-edge calculator, which is where I run numbers before I sit down at a table.
When you combine rule differences with a chart that assumes the wrong rules, your “simple” strategy can cost around 0.53%.
A rules-matched basic strategy costs closer to 0.14% under liberal Strip-style rules. That’s the heart of why matching matters.
How to read a blackjack basic strategy chart
Charts look intimidating because they’re dense with letters. But they’re simply a tidy way to pick the move with the best expected return for each player hand vs the dealer upcard.
Charts usually split your hands into three groups:
- Hard hands — no ace counted as 11 (e.g., 10–8 = 18 hard).
- Soft hands — include an ace counted as 11 (e.g., A‑6 = soft 17).
- Pairs — two cards of the same rank you might split (e.g., 8‑8).
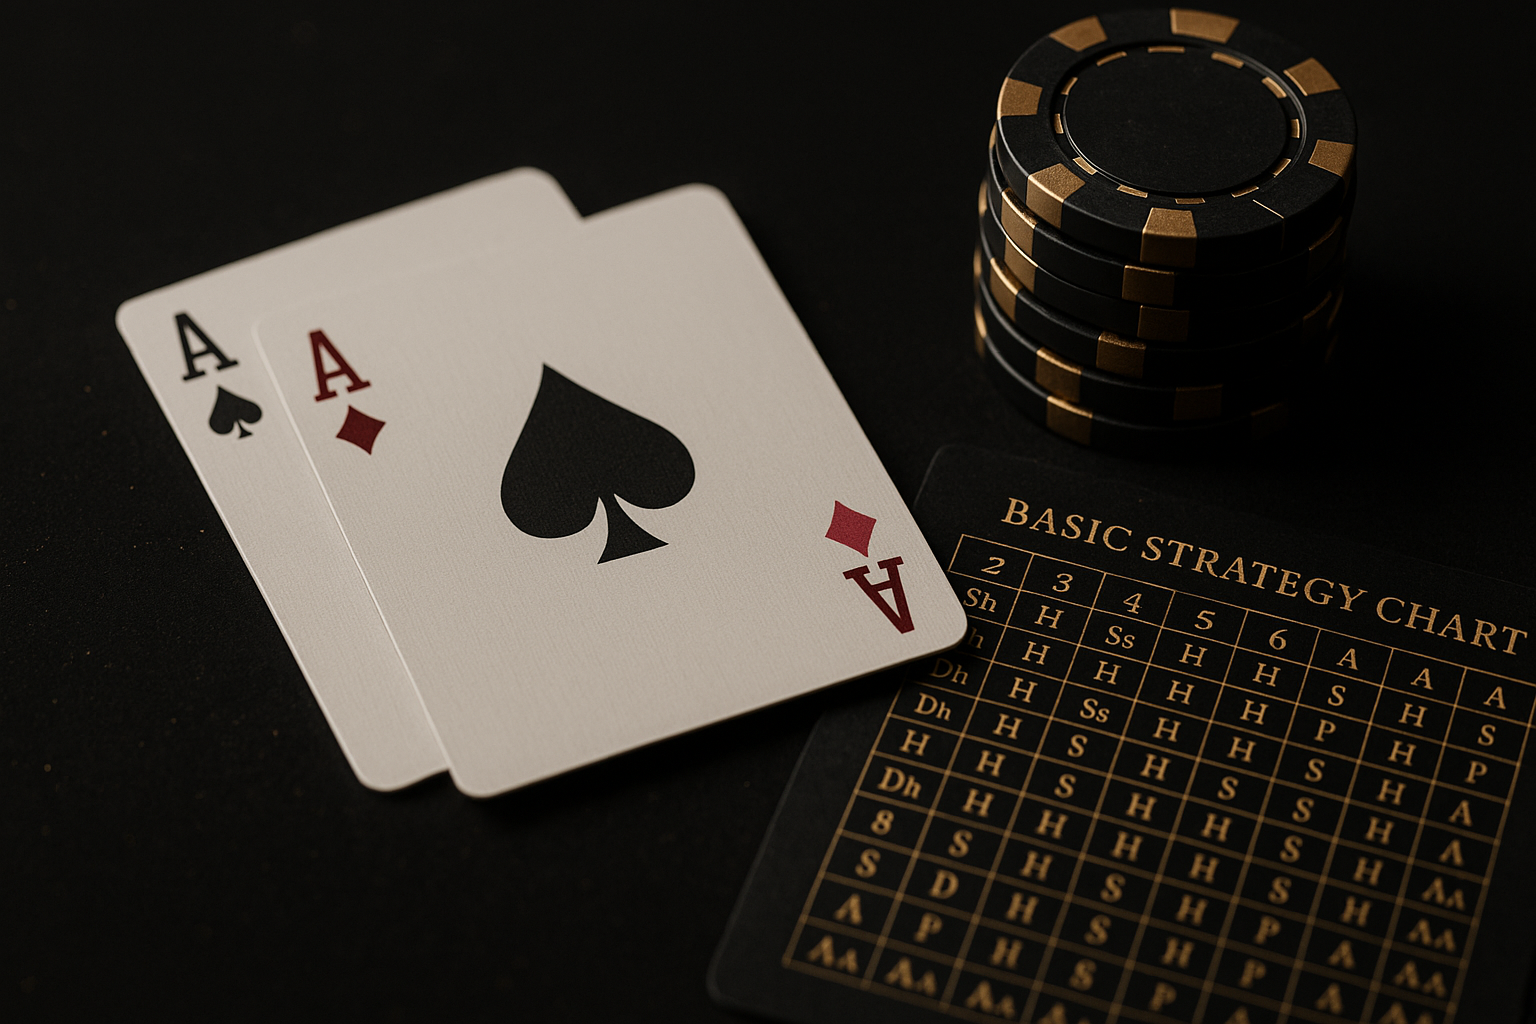
The dealer’s upcard runs across the top, your hands down the side, and each intersecting cell tells you the mathematically best action.
Common abbreviations you’ll see:
- H = Hit
- S = Stand
- D = Double if allowed, otherwise hit
- P = Split
- Surrender = Surrender if available, otherwise follow the fallback
A crucial detail: the chart must state whether the dealer hits or stands on soft 17. That single line changes some decisions and shifts the house edge.
If the chart doesn’t state it, don’t trust it for exact play.
Generate the exact chart for the table you’re at (step-by-step)
Don’t memorize some generic “chart for beginners.” Generate one that matches the table rules.
The easiest practical tool I use is the Wizard of Odds strategy calculator—pick your rules, and it spits out the correct chart for that exact rule set.
Here’s the checklist to run before you pick or generate a chart:
- Number of decks
- Blackjack payout (3:2 vs 6:5)
- Dealer hits or stands on soft 17
- Doubling rules (any two cards or restricted)
- Doubling after split allowed?
- Resplitting aces allowed?
- Late surrender available?
- Dealer peeks for blackjack?
- Are blackjacks paid normally after a split?
Once you’ve noted those, go to the Wizard of Odds strategy calculator, set the options to match the table, and download or print the chart.
It literally builds the exact matrix you need.
Two quick tips while you’re at it:
- If the casino posts the rules on a placard, don’t assume standard—read it. If something’s ambiguous, ask the dealer or floor.
- Keep the chart as a mental map. You don’t want to be the person consulting a laminated sheet at a crowded table—learn the handful of frequent, marginal decisions and keep the chart for reference.
Concrete hands: what a rules-matched chart changes (hard 16 & soft 18)
Two hands that regularly cause arguments: hard 16 vs dealer 10, and soft 18 (A‑7) vs dealer 6.
They’re good examples because the correct play can flip depending on table rules, and those flips move the expected loss by measurable amounts.
Hard 16 vs dealer 10 is the classic “ouch” hand.
If late surrender is available, basic strategy commonly recommends surrender for that matchup because the expected loss from continuing is worse than forfeiting half the bet.
If surrender isn’t on the menu, the chart gives the fallback—usually hit rather than stand—depending on the rule set in play.
The recommendation to surrender against a dealer 10 when allowed is a standard basic-strategy play.
Soft 18 sits in the middle: it’s often a stand, but against certain dealer upcards and under some rules it becomes a double or even a hit.
Because soft 18 can be played aggressively (double) against a weak dealer upcard, using the wrong chart will push you toward too conservative or too aggressive plays.
Those two hands show the point: a few wrong decisions across multiple hands add up.
Using a generic/simple chart under Strip-like rules can cost about 0.53%. Matching the chart to the table’s specifics shrinks that extra leak down to roughly 0.14%, per Wizard of Odds’ comparison of simple vs complete strategy under those rules.
Which rules change the chart most (short list)
If you want to triage what to check first, here are the biggest rule levers that change strategy and edge:
- Dealer H17 vs S17 — alters soft-hand plays and overall edge; always note it.
- Number of decks — measurable swing in house advantage between one and eight decks.
- Late surrender — changes strategy on marginal hard hands like 16 vs 10.
- Doubling restrictions — whether you can double on any first two cards or only certain totals.
These are the ones worth checking before you start making decisions with real money on the table.
Practical tableroom behavior: quick decisions and memory aids
You don’t need to memorize a massive chart to improve your play immediately. Learn the big rules, and use the matched chart for the weird spots.
- Stand on hard 17+
- Hit hard 8 or less
- Hit soft 15 or less; stand soft 19+
- Double when you have 10 or 11 against weak dealer cards—check the chart for exact cutoffs
For the marginal hands—hard 16s, soft 18, complicated pair-splitting—either memorize the matched chart’s guidance or save it on your phone before you sit.
A few right moves per hour compound into a meaningful difference in expected losses.
And a brief real-world note: casinos vary on letting you consult a personal chart at the table. Some don’t care; some do.
If you’re unsure, ask the dealer politely or memorize the spotty parts before you sit down.
Where to run the numbers yourself
If you want to see how different rule sets change the house edge or build a chart for a weird set of options, use the blackjack house-edge calculator and the strategy generator.
These let you toggle decks, payouts, surrender, doubling options and see the resulting edge.
For explanation of how the basic-strategy cost numbers were derived, the Wizard of Odds basics page is a good companion read.
Running the calculator before you play is the functional equivalent of checking the weather before leaving the house—takes a minute and saves you from getting soaked.
One thing I do: when a rule is unusual (6:5 blackjack, odd doubling restrictions), I run the calculator and if the edge moves a lot, I either pass on the table or reduce my bet.
That’s not exotic — it’s just playing with awareness.
If you’re curious about how deck count alone matters, the site’s deep dive on why the number of decks matters explains the mechanics behind those percentage swings.
Responsible-play reminder
Basic strategy reduces the expected cost of play; it doesn’t guarantee a profit.
Treat blackjack as entertainment: set loss limits, time limits, and don’t chase losses.
The math improves your chances long-term, but it can’t stop short-term variance.
One simple line I tell friends: matching your blackjack basic strategy chart to the table is like getting a small permanent discount on every hand you play. It’s boring but effective.
Conclusion
One thing to remember: a blackjack basic strategy chart is only as useful as its match to the table you’re at.
Spend a minute to check decks, S17/H17, surrender and doubling rules, generate the exact chart, and you’ll quietly shave off a meaningful chunk of the house edge.
It won’t make you rich, but it will stop you from giving extra money away for no reason.
Frequently Asked Questions
What is a blackjack basic strategy chart?
A blackjack basic strategy chart is a table that tells you the mathematically best move—hit, stand, double, split or surrender—based on your hand and the dealer’s upcard for a specific set of table rules.
How do I read a blackjack strategy chart?
Find your hand on the left (hard, soft or pair), find the dealer upcard across the top, and follow the cell where they meet.
Abbreviations like H, S, D and P tell you the action to take. Remember to confirm the chart’s rule assumptions (decks, S17/H17, surrender, doubling) first.
Where can I get a chart matched to my table?
Use the Wizard of Odds strategy calculator. Set the exact rules of your table and it will generate the proper chart for those rules.
Will matching the chart guarantee I win?
No. Matching the chart minimizes your expected losses and gives you the best long-term decision in each situation, but it doesn’t stop short-term swings or ensure profit.
How much does matching the chart actually help?
Under common Strip-style rules, using a simple, non–rules-matched chart can cost about 0.53%; switching to a rules-matched, more complete basic strategy drops that to roughly 0.14%, according to Wizard of Odds’ comparisons.
That difference is small per hand but meaningful over many hands.